
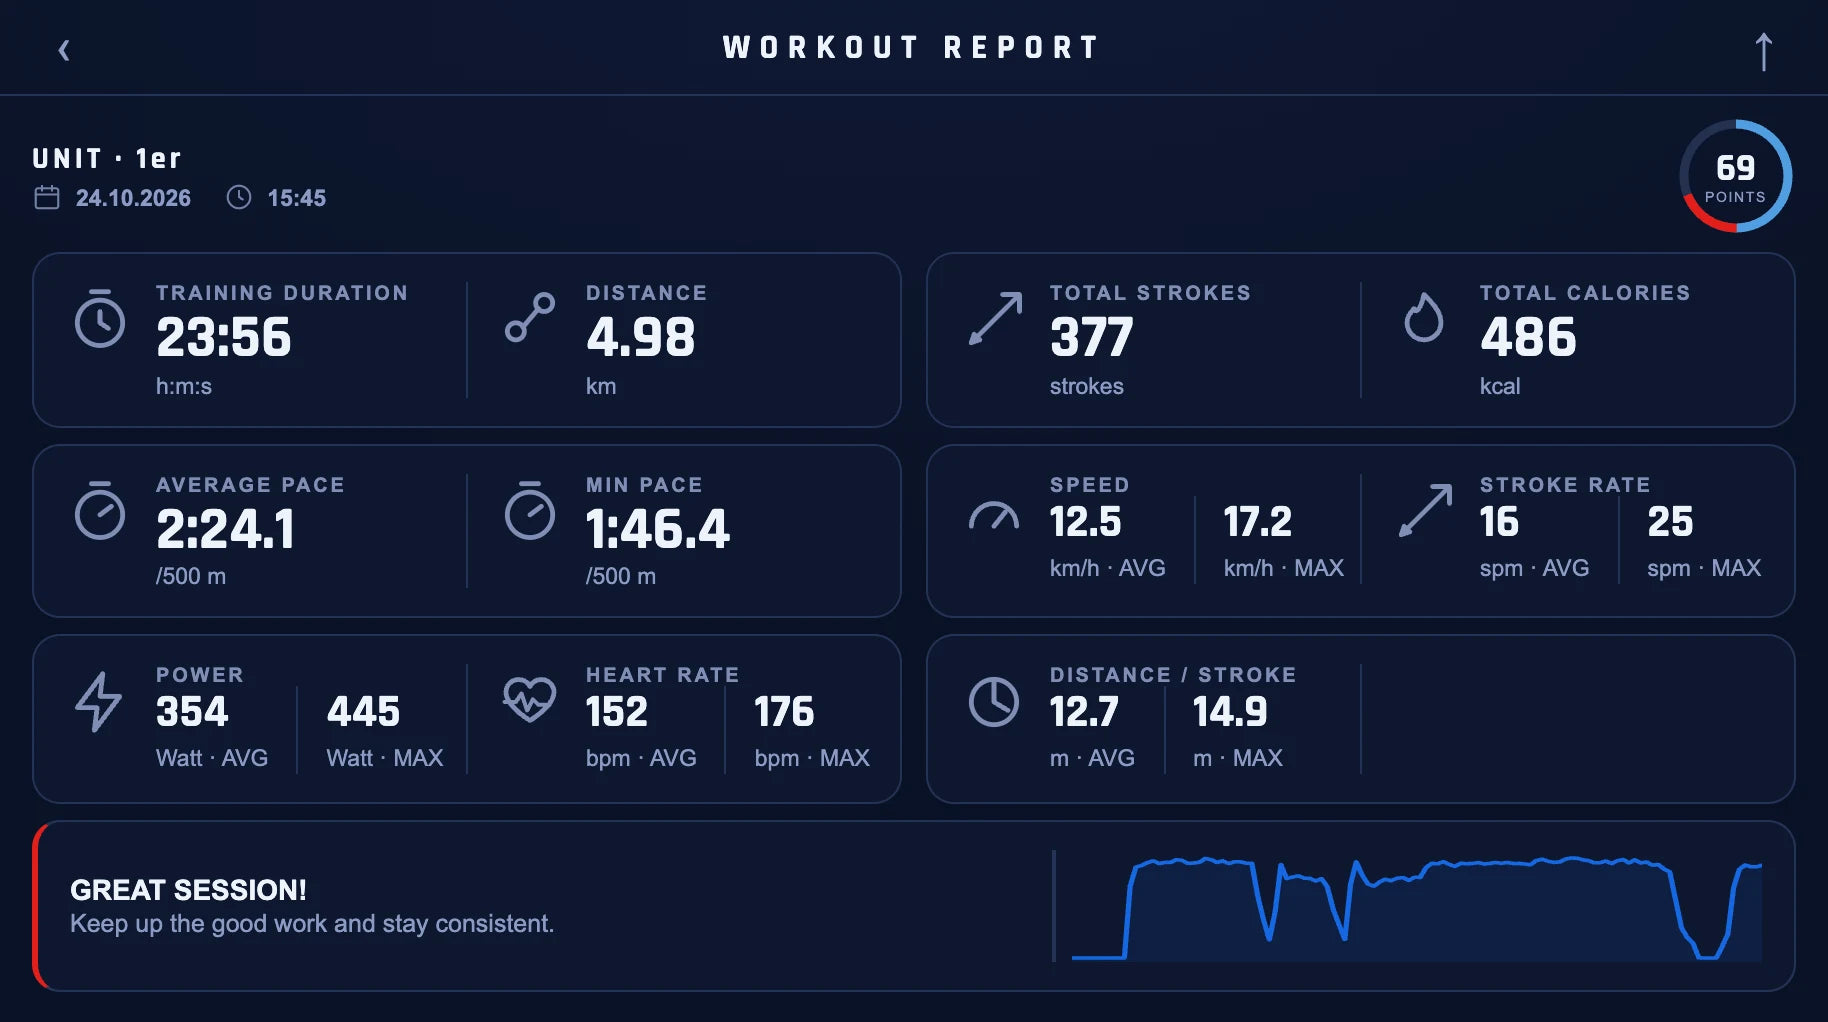
Report — overview
The facts of your outing.
Right after the outing: time, distance, strokes, calories, average and best values for pace, speed, stroke rate, power and heart rate — and one score from 0 to 100.
- Average and maximum for every value
- Distance per stroke
- A score that makes outings comparable

Report — technique
Your average stroke.
The acceleration curve of your average stroke across the whole outing, against the reference — plus one concrete tip for the next outing.
- Average of all strokes of the outing
- Match and power in percent
- One learning tip per outing
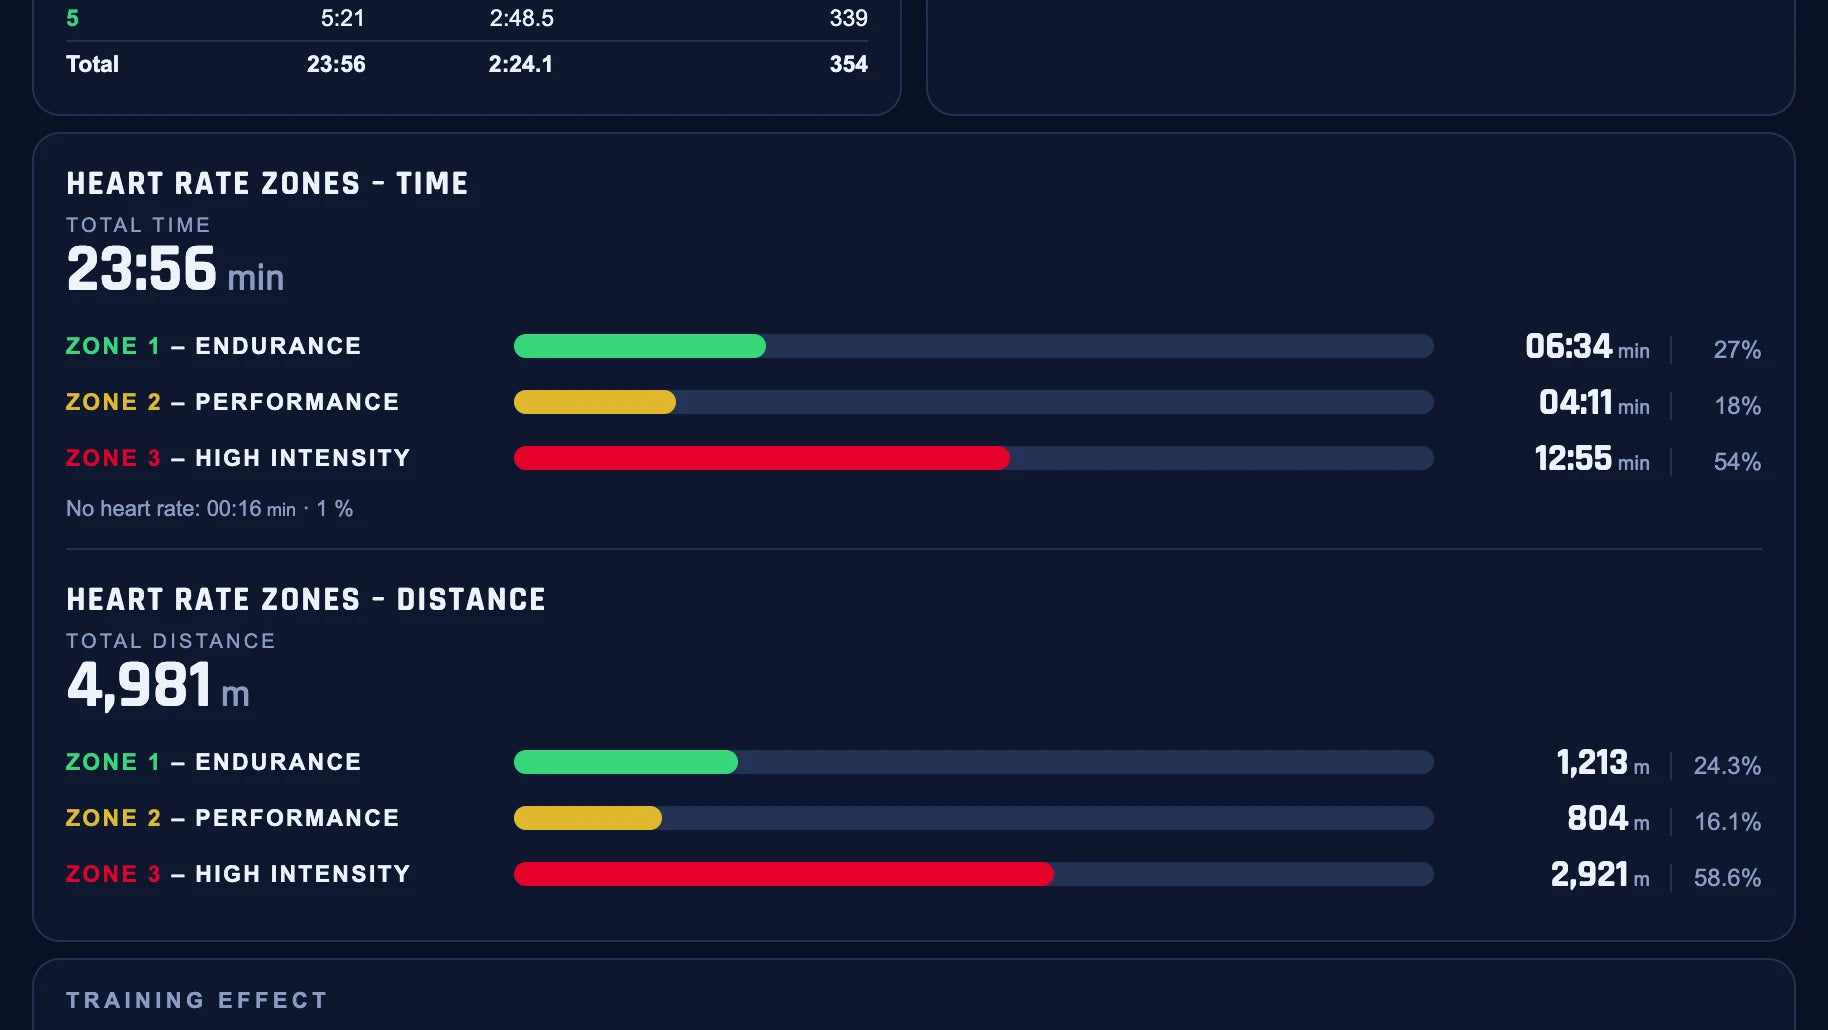
Report — heart rate
Heart-rate zones. By time and by distance.
With a heart-rate belt, ROWPILOT shows how long and how far you rowed in each of three zones: endurance, performance and high intensity.
- Zone 1 Endurance, Zone 2 Performance, Zone 3 High intensity
- Time and distance per zone, each in percent
- No belt — no zones: nothing is guessed
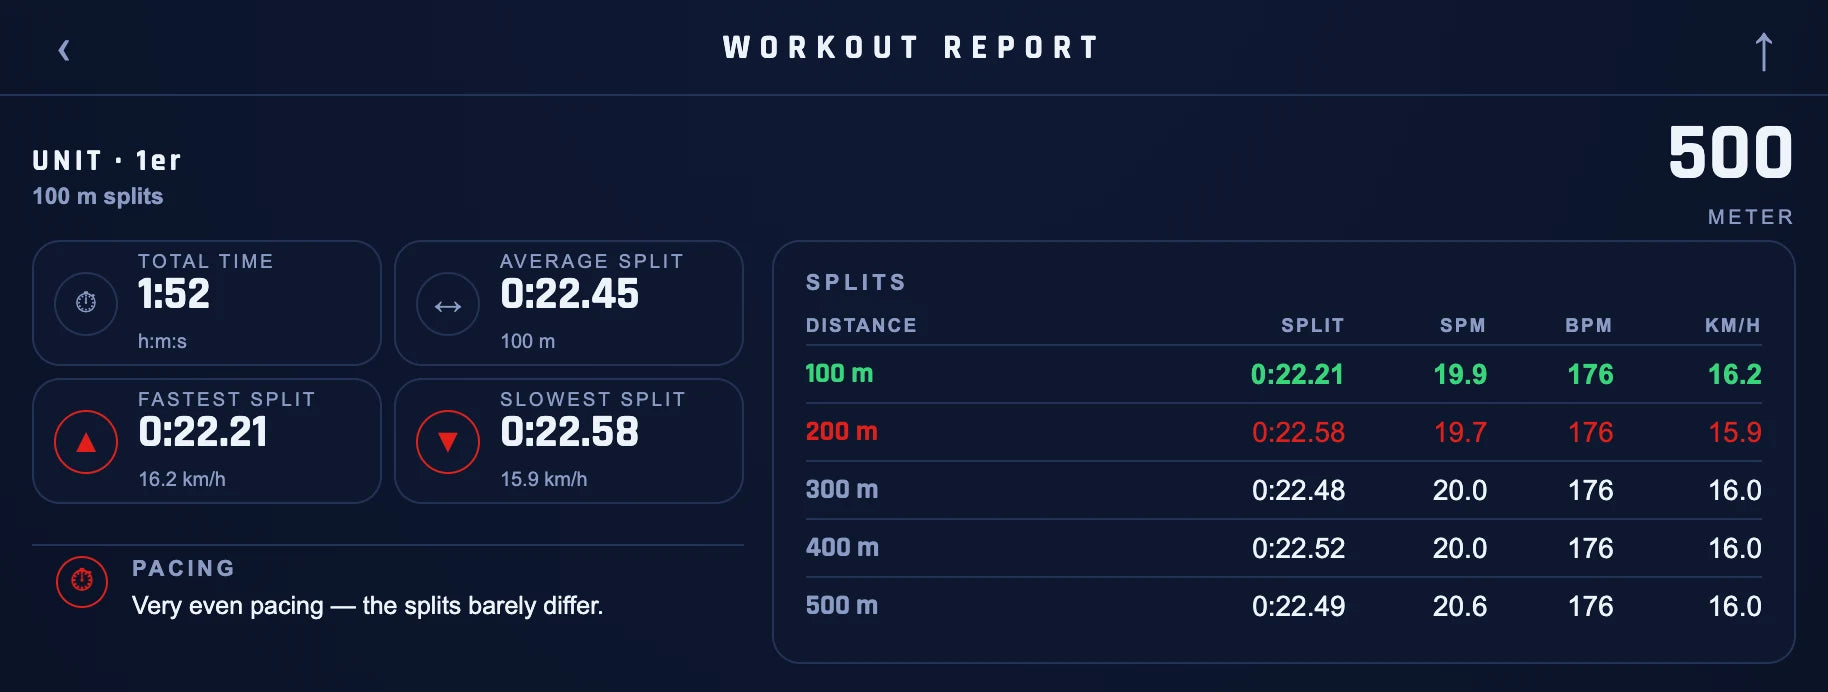
Report — race
Every race, every 100 metres.
Each race of an outing gets its own protocol: total time, fastest and slowest section and every 100 metres with split, stroke rate, heart rate and speed.
- Several races per outing, each saved
- 100 m sections with split, stroke rate, heart rate and speed
- Pacing verdict on how you raced

Summary — all outings
Where you stand. What to improve.
Across all outings on the device: total time and distance, average pace, your score trend and up to three concrete points to improve.
- Score trend over your last outings
- Improvement tips from your own data
- Up to 100 outings on the device, favourites are kept